
Increases in NC Electricity Prices Since 2017
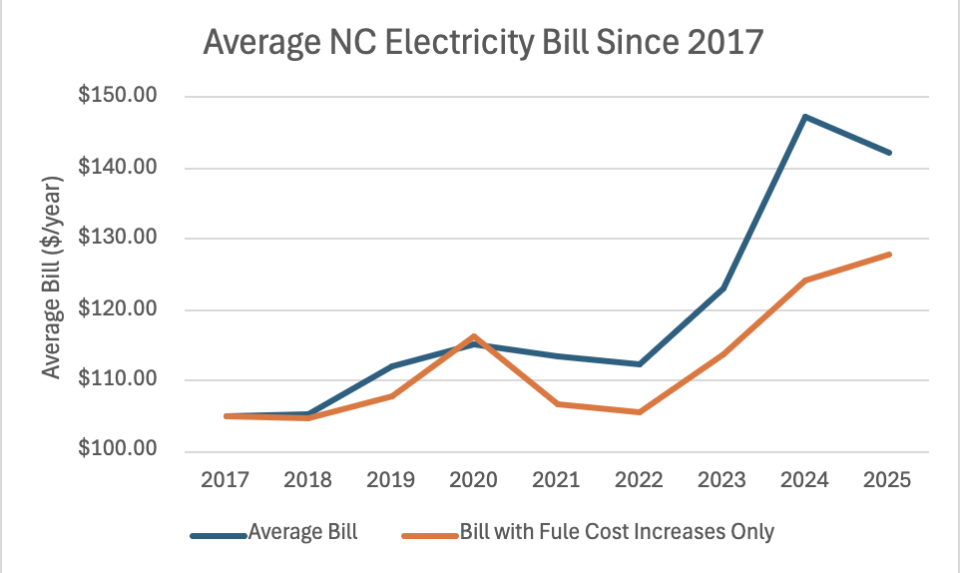
Graph showing how average North Carolina electricity rates have been going up in recent years due to increases in fuel costs, primarily due to natural gas costs. As costs continue to go up for families in response to SB266, the information will be further tracked here. County-level functionality will be added in the coming months.
What parts of our state are covered by Duke Energy Carolinas and what parts by Duke Energy Progress?
3. Data is from Duke Energy Carolinas Fuel Dockets sub 1104, 1129, 1163, 1190, 1228, 1250, 1263, 1190, 1228, 1250, 1263, 1282, 1304 and Duke Energy Progess Fuel Dockets sub 1107, 1146, 1173, 1204, 1250, 1272, 1292, 1321, 1341
Power Bill Data
Tab/Accordion Items
| Year | Average Bill (DEC) | Increase with Only Fuel Cost (DEC) |
|---|---|---|
| 2017 | $104.51 | $104.51 |
| 2018 | $100.74 | $102.10 |
| 2019 | $107.24 | $103.28 |
| 2020 | $114.28 | $106.60 |
| 2021 | $107.45 | $104.88 |
| 2022 | $105.34 | $102.28 |
| 2023 | $115.01 | $109.09 |
| 2024 | $142.12 | $121.78 |
| 2025 | $135.35 | $131.08 |
| Year | Average Bill (DEP) | Increase with Only Fuel Cost (DEC) |
|---|---|---|
| 2017 | $105.98 | $105.98 |
| 2018 | $113.94 | $109.44 |
| 2019 | $120.69 | $116.52 |
| 2020 | $116.63 | $134.57 |
| 2021 | $124.64 | $110.25 |
| 2022 | $125.52 | $111.36 |
| 2023 | $137.98 | $122.24 |
| 2024 | $157.30 | $128.42 |
| 2025 | $155.16 | $121.95 |
| Year | Average Bill | Bill with Fuel Cost Increases Only |
|---|---|---|
| 2017 | $105.02 | $105.02 |
| 2018 | $105.36 | $104.67 |
| 2019 | $111.95 | $107.92 |
| 2020 | $115.10 | $116.39 |
| 2021 | $113.47 | $106.76 |
| 2022 | $112.40 | $105.46 |
| 2023 | $123.05 | $113.69 |
| 2024 | $147.43 | $124.11 |
| 2025 | $124.28 | $127.89 |